Moving Average - Definition, Formula, and Examples
What is Moving Average?
Type of Moving Average
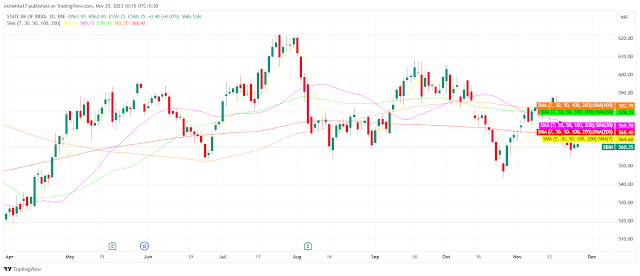
To compute a simple moving average, you take the arithmetic mean of a specified number of data points over a certain period. For instance, a 10-day SMA for a stock price involves adding up the closing prices of the last 10 days and dividing the sum by 10.
SMA is particularly useful for smoothing out fluctuations or noise in a dataset, providing a clearer picture of the underlying trend over a specified time frame. Traders and analysts use SMAs to identify trends, potential reversals, or support/resistance levels in financial markets or to analyze other time-series data.
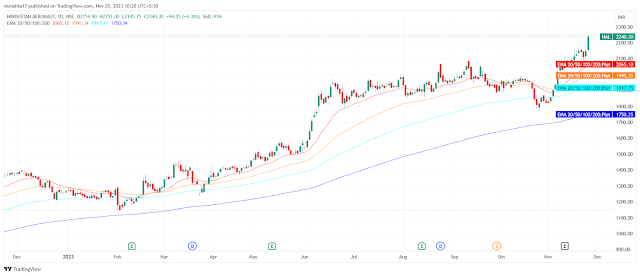
2. Exponential Moving Average: An Exponential Moving Average (EMA) is a type of moving average that gives more weight and significance to the most recent data points in a dataset while still considering older data. Unlike the Simple Moving Average (SMA), where each data point in the period carries equal weight, the EMA places greater importance on the most recent observations.
The calculation of an Exponential Moving Average involves a formula that considers the current price, the previous EMA value, and a smoothing factor (usually represented as a percentage based on the chosen time period). The formula for calculating the EMA is:
Where:
- represents the latest closing price or data point.
- is the previous EMA value.
- The Smoothing Factor depends on the chosen time period and is typically calculated using the formula: . For example, for a 10-day EMA, the smoothing factor would be .
EMA reacts more sensitively to recent price changes compared to the SMA, making it quicker to respond to price movements. Traders and analysts often use EMAs to identify trends, potential reversals, and to generate buy or sell signals in financial markets, technical analysis, and other data analysis applications.
Simple Moving Average Calculation:
The formula for calculating a Simple Moving Average (SMA) involves summing up a specified number of data points and then dividing the sum by the number of data points. The formula is straightforward:
Let's consider an example to calculate a 5-day Simple Moving Average for a set of closing prices:
Closing prices for a stock over 7 days: 25, 28, 30, 32, 29, 31, 35
To find the 5-day SMA:
Calculate the sum of the closing prices for the most recent 5 days: Sum of the last 5 days = 29 + 31 + 35 = 95
Divide the sum by the number of data points (which is 5, as it's a 5-day SMA): SMA = Sum of data points / Number of data points SMA = 95 / 3 = 31.67
Therefore, the 5-day Simple Moving Average of the closing prices for the given 7-day period is 31.67.
This calculation involves taking the average of the most recent 5 days' closing prices, and as new data comes in, the calculation shifts to the next set of 5 data points, discarding the oldest and including the most recent one.
The formula for calculating an Exponential Moving Average (EMA) involves using a smoothing factor, a multiplier that gives more weight to the most recent data points. The formula for EMA calculation is:
Where:
- represents the latest closing price or data point.
- is the previous day's EMA value.
- The Smoothing factor is determined by the chosen time period. It is calculated using the formula: .
Let's calculate a 5-day Exponential Moving Average for a set of closing prices:
Closing prices for a stock over 7 days: 25, 28, 30, 32, 29, 31, 35
Given that we want to calculate a 5-day EMA:
Calculate the smoothing factor:
Calculate the initial SMA as there's no previous EMA for the first value. For the sake of this example, the SMA for the first 5 days will be used as the initial EMA:
Calculate the first EMA using the SMA and the first day's closing price:
Repeat the process for subsequent days:
Therefore, the 5-day Exponential Moving Average for the given 7-day period is approximately 29.53 for the 6th day and approximately 31.35 for the 7th day.
 |
| EMA 20, 50, 100, 200 |


No comments